How to
Open the Performance tools
To open the Performance tools:
press Shift + F5
select “Performance” from the Web Developer submenu in the Firefox Menu (or Tools menu if you display the menu bar or are on OSX)
select “Performance” from Tools button, in the Toolbar, if you have one:

Record a profile
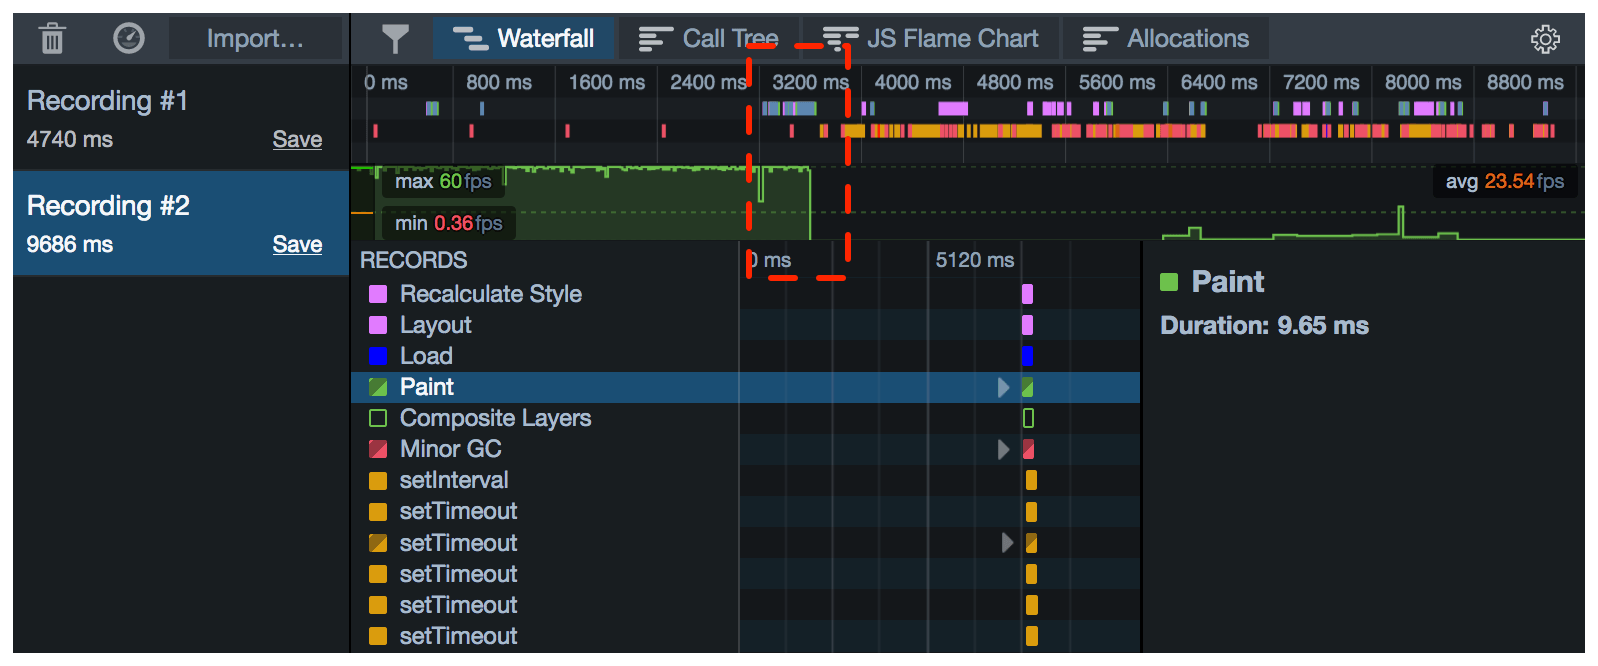
To start a new recording, press the stopwatch icon in the Recordings pane. To stop, press it again:
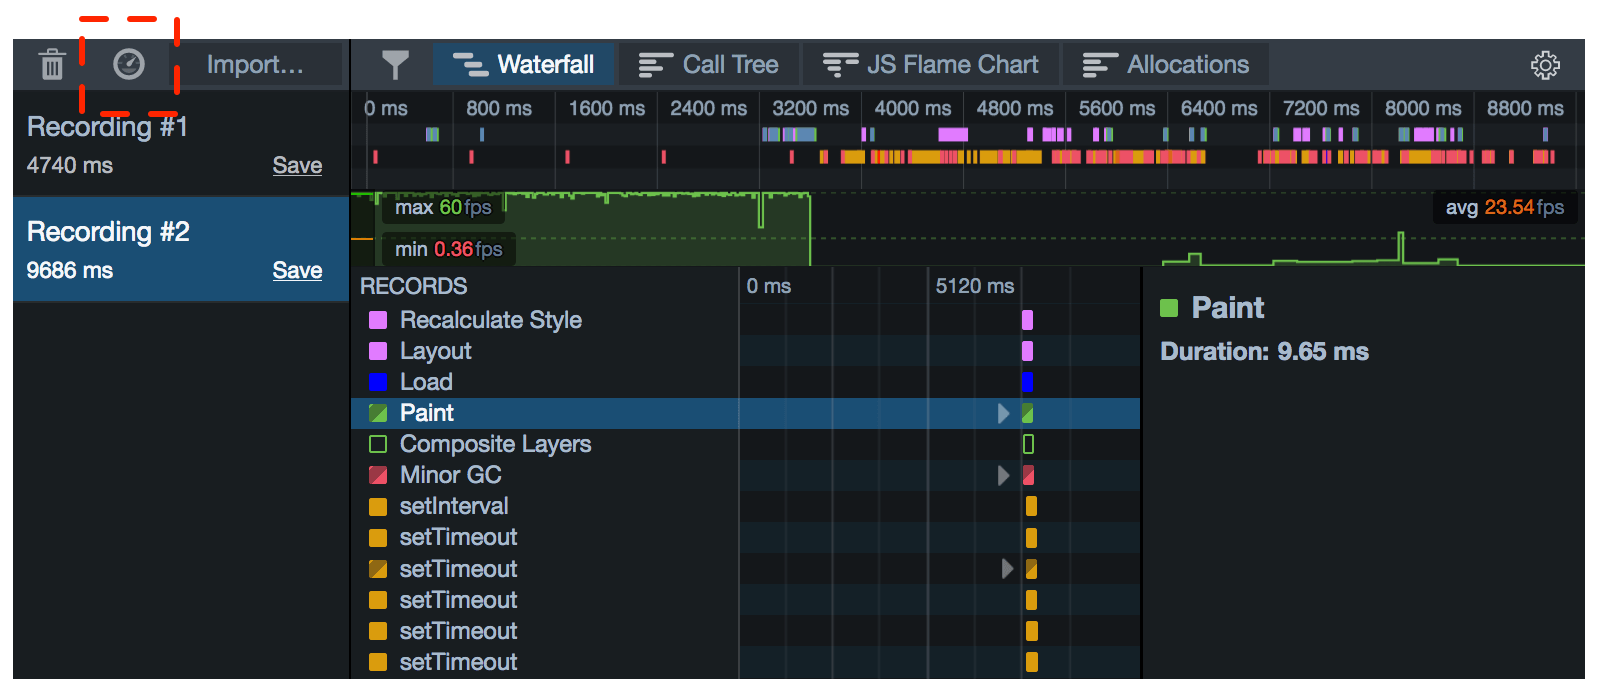
You can also start and stop recording from the Web Console, using console.profile() and console.profileEnd().
Clear all loaded profiles
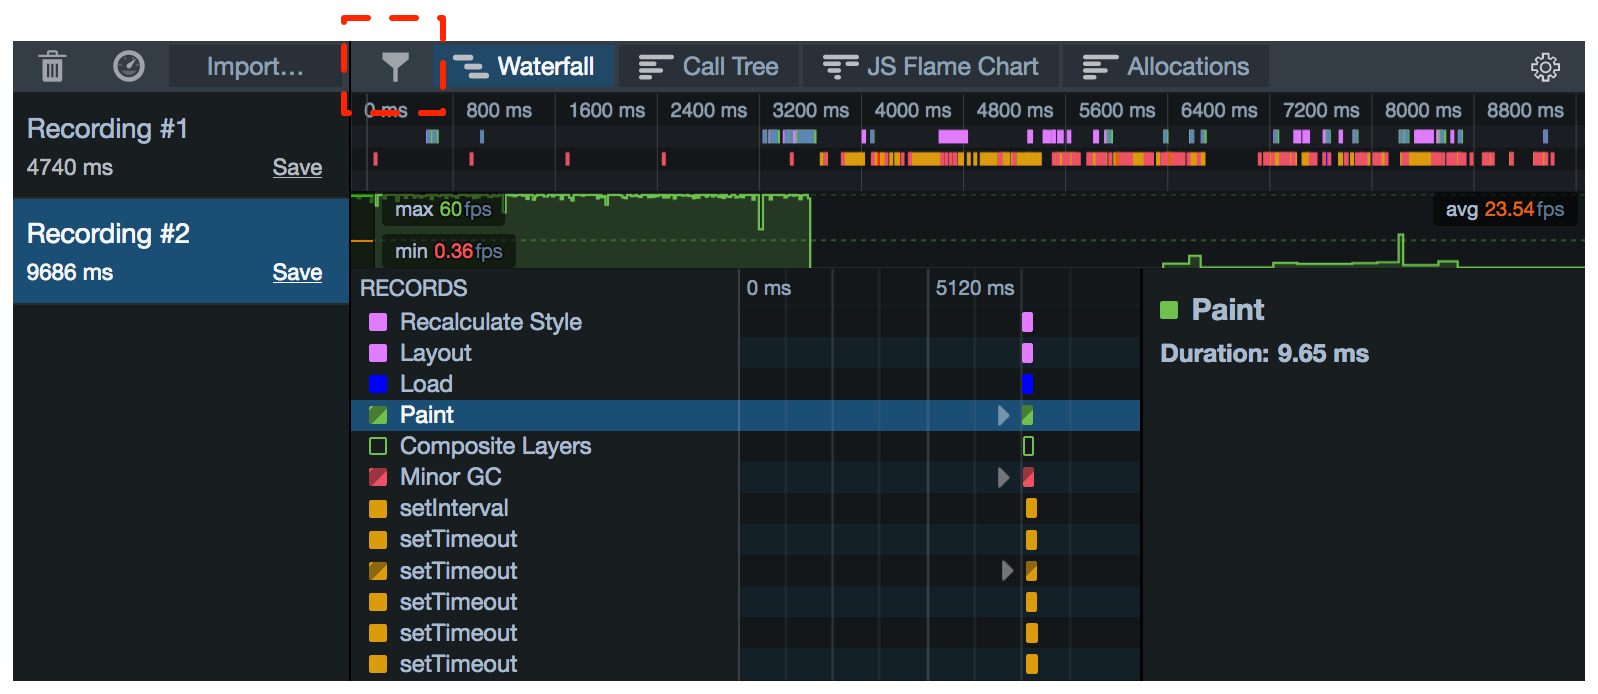
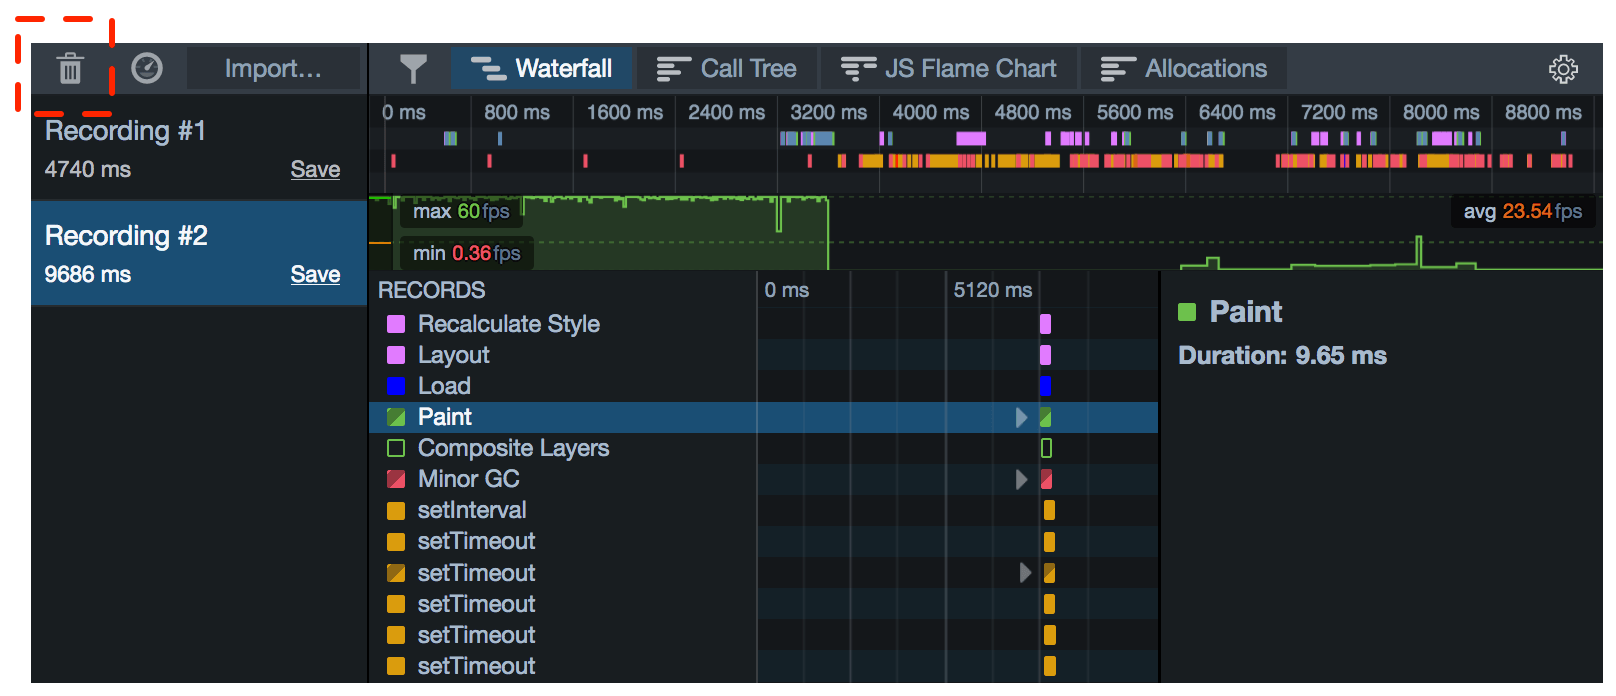
To clear all loaded profiles, click “Clear”.
Note
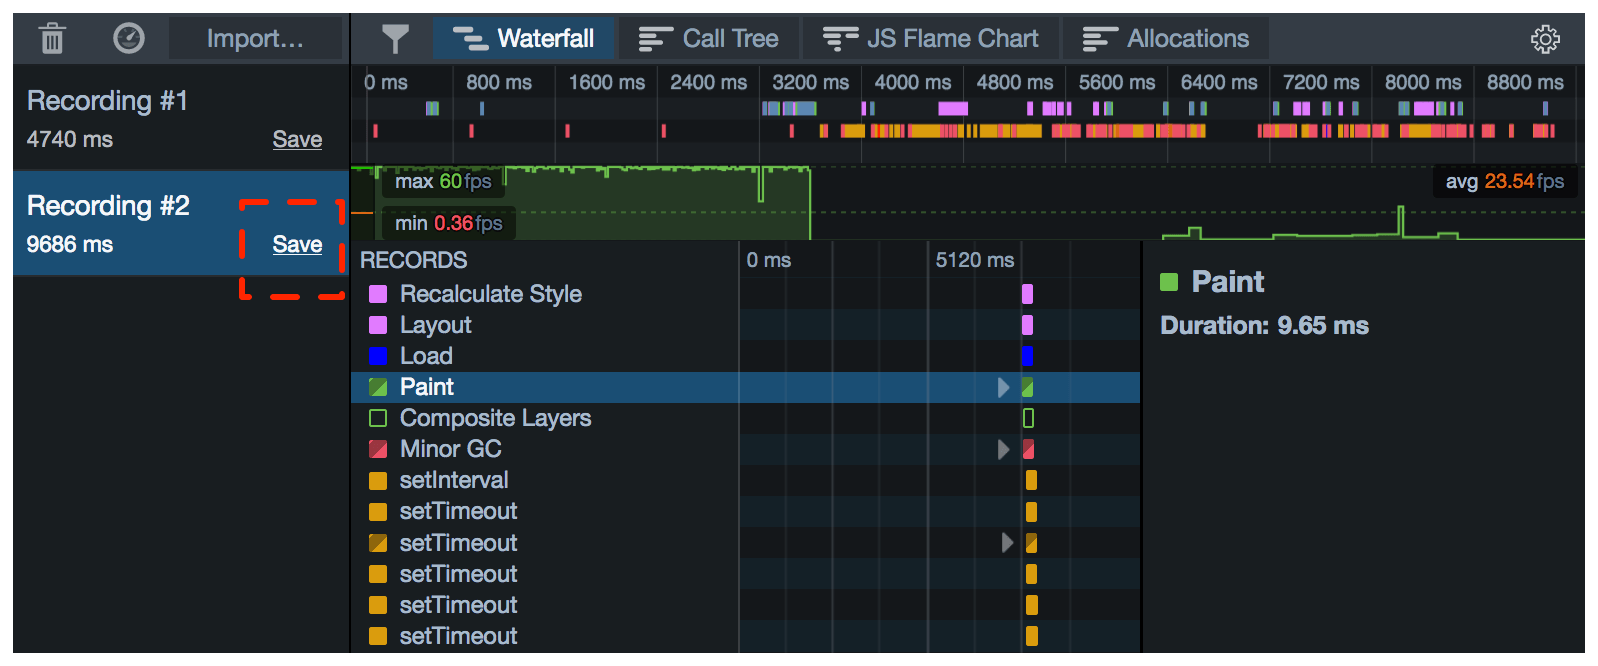
If you do this, you’ll lose any loaded profiles that you have not saved.
Select a tool
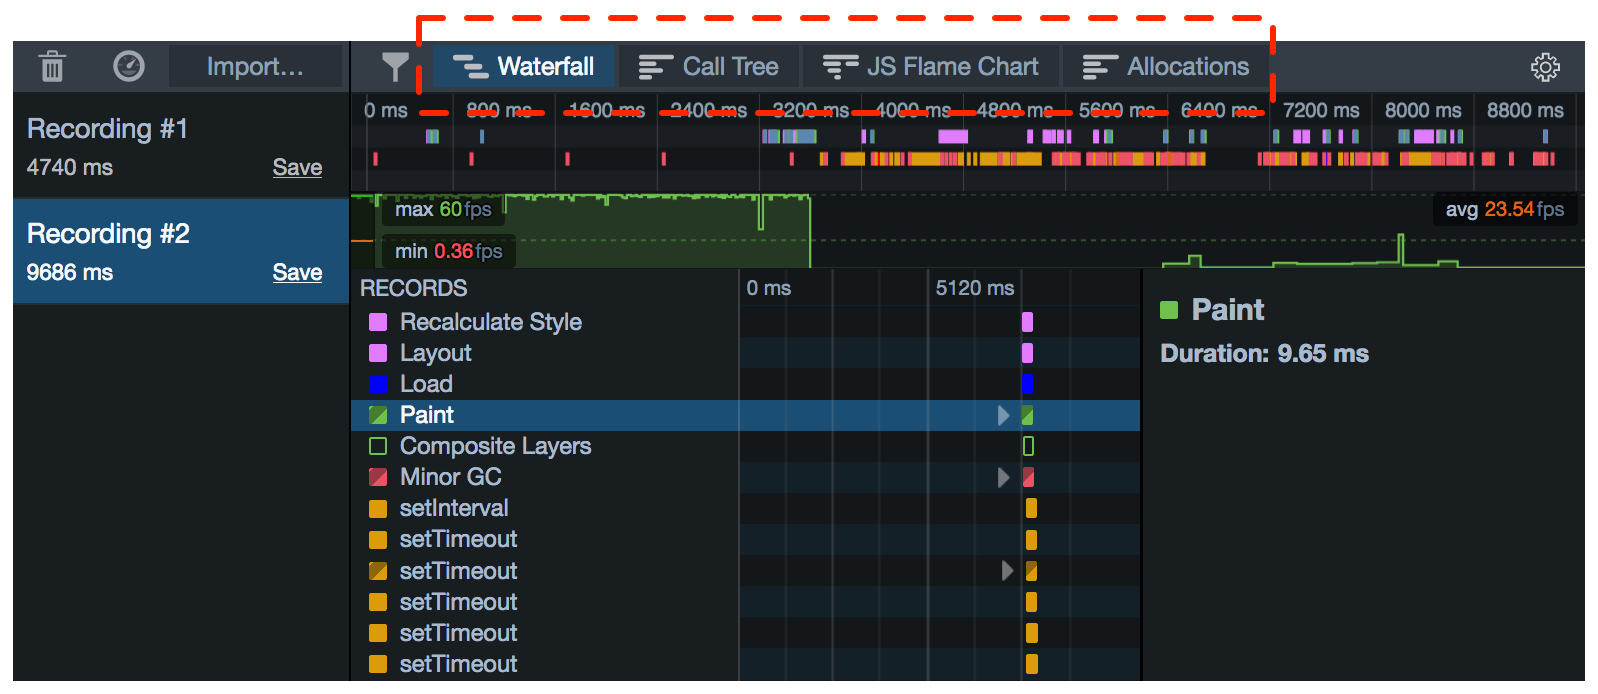
To switch between the Waterfall, Call Tree, and Flame Chart tools, use the buttons in the toolbar:
